


Every Network Lives Somewhere: Geolocation Maps Come to ASN Pages
Get Unlimited Access to IPinfo Lite
Start using accurate IP data for cybersecurity, compliance, and personalization—no limits, no cost.
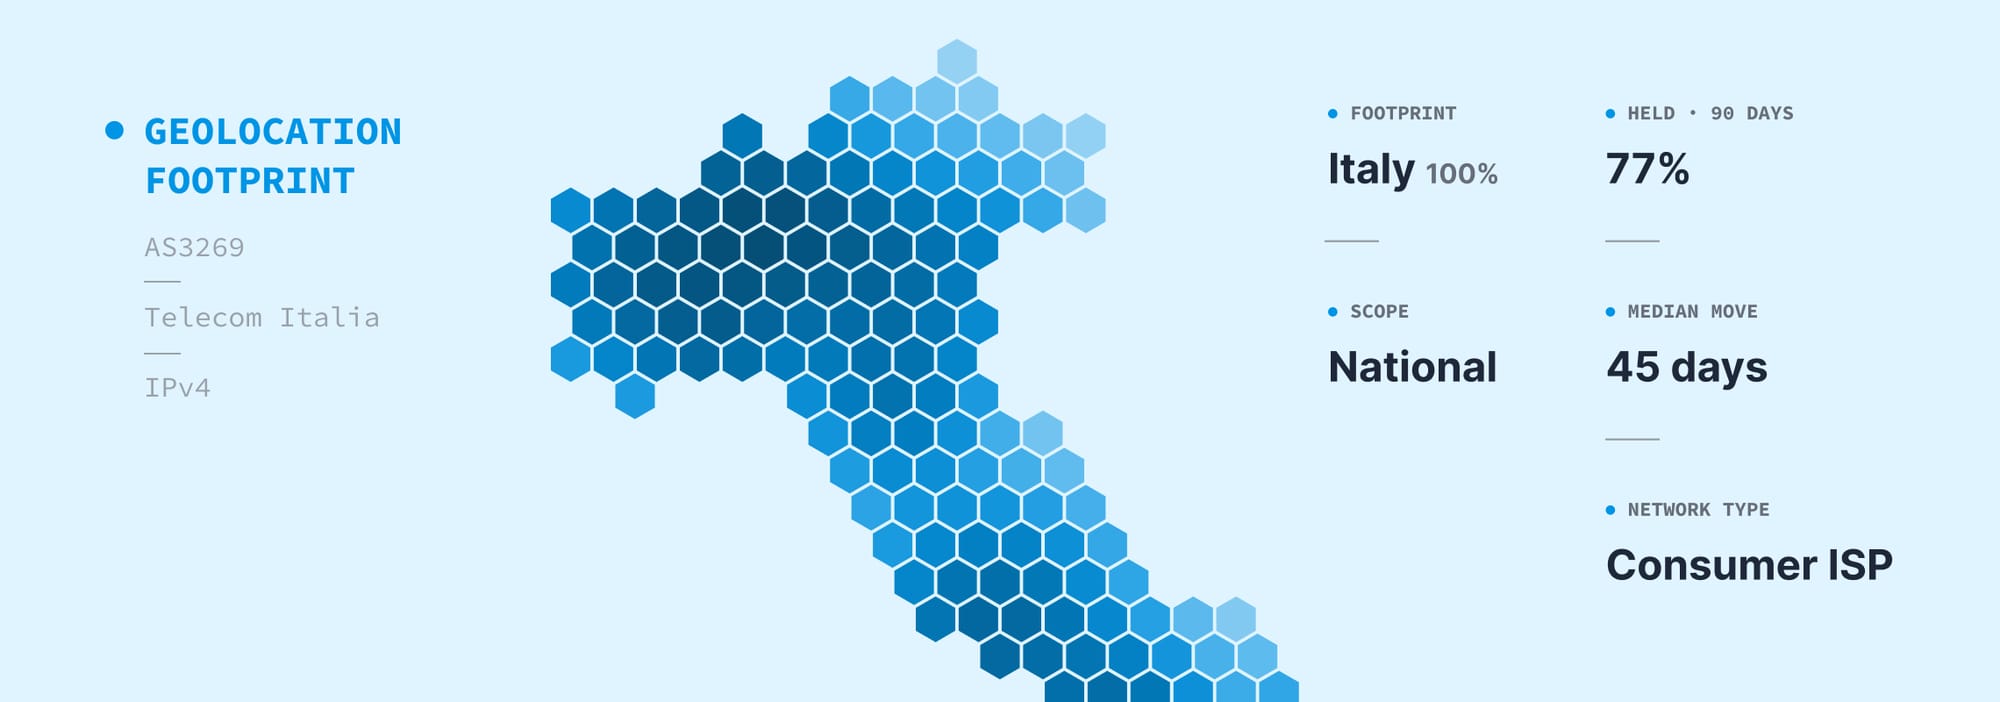
Sign up for freePull up Telecom Italia's ASN page and you'll see something that looks less like network data and more like a census: dark hexagons over Milan, Rome, and Naples, fading out across the countryside. It's a population map of Italy, drawn entirely from IP addresses. Pull up M247, a hosting provider popular with VPN services, and the picture changes completely: a constellation of city-sized dots scattered across 36 countries, with no home country in sight. And Starlink? Starlink lights up 106 countries at once.
Same feature. Three networks. Three completely different stories.
Today we're introducing geolocation distribution on ASN pages: an interactive map and a set of stability metrics that show you where a network's IP addresses actually live, and how consistently they stay there. It's the natural companion to ASN Activity Profiles: activity tells you when a network is awake; geolocation tells you where it sleeps.
Why a Network's Footprint Tells You Something
Registration records tell you who a network is registered to and where the company is headquartered. That's useful, but it's paperwork. A hosting company registered in Romania can operate exit nodes in Tokyo. A "US carrier" can be a global backbone. An ISP's WHOIS country tells you where the lawyers are, not where the users are.
The geolocation footprint is different. It's derived from where the network's IP addresses are actually observed operating, measured continuously, at scale, from our global points of presence. It's the difference between reading a company's letterhead and watching where its trucks drive.
And once you can see the footprint, a second question becomes just as interesting: does it hold still? A residential ISP reshuffles addresses between cities every few weeks as DHCP leases churn. A CDN's addresses stay put for years. Neither is "better," but knowing which behavior to expect from which network is the difference between trusting a geolocation result and guessing.
What's on the Page
Every ASN page now includes a Geolocation section with two parts, available for both IPv4 and IPv6:
The footprint map. An interactive hexagon map showing the share of the network's IP footprint in each area. Darker hexagons mean more of the network lives there. It's density, not just presence: you can tell the difference between a network that serves a city and one that merely touches it.
Countries by IP share. A ranked breakdown of the footprint by country, with percentages. For a national ISP this is one bar at 100%. For a global network it's a long tail worth scrolling.
Below the map, four stability metrics:
- Held location over 90 days: the share of the network's IPs that kept the same geolocation over the last 90 days
- Held location over 1 year: the same measure over a full year
- Median days between moves: when IPs do move, how long they typically stayed put first
- Geolocation scope: the granularity at which this network's geolocation can be trusted, National or Global
One thing you'll notice on the page, and it's worth repeating here: these numbers should be read relative to the network type, not as a quality score. 77% held over 90 days is perfectly normal for a residential ISP with DHCP churn. The same number on a datacenter network would be strange. The metrics describe behavior; the network type supplies the context.
Five Networks, Five Completely Different Maps
The best way to understand the feature is to look at real networks. Here are five, and no two look remotely alike.
Telecom Italia (AS3269)
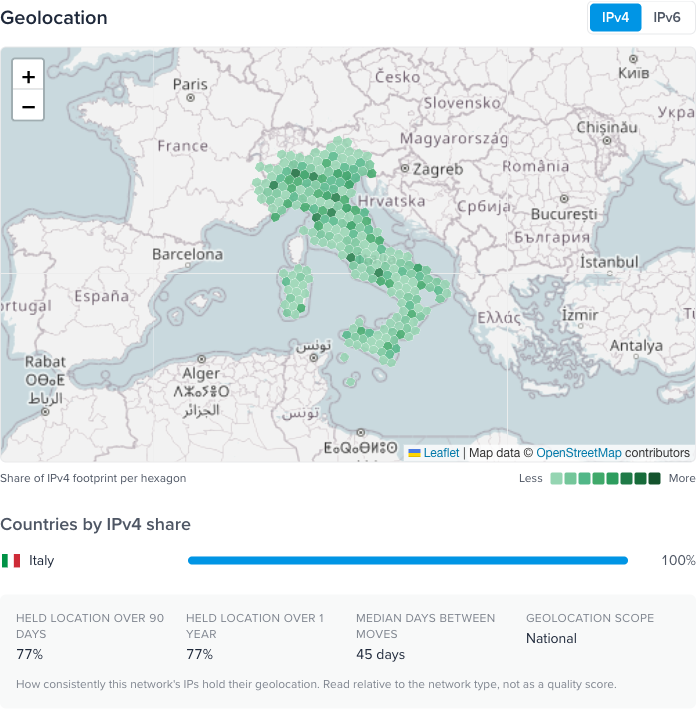
- Footprint: Italy, 100%
- Scope: National
- Held location over 90 days: 77%
- Median days between moves: 45 days
Telecom Italia's map is Italy itself. The hexagons trace the population: dense over Milan and the industrial north, bright along the Rome–Naples corridor, thinning out across Sardinia and the rural south. This is what a classic eyeball network looks like: the footprint of millions of homes.
Now look at the stability numbers. Only 77% of these IPs held their location over 90 days, and the median IP moves every 45 days. Alarming? Not at all. This is DHCP churn, the ordinary reshuffling of addresses across a consumer network. The IPs move constantly. They just never, ever leave Italy. That combination, restless at the city level and absolute at the country level, is the signature of a national residential ISP.
Starlink (AS14593)
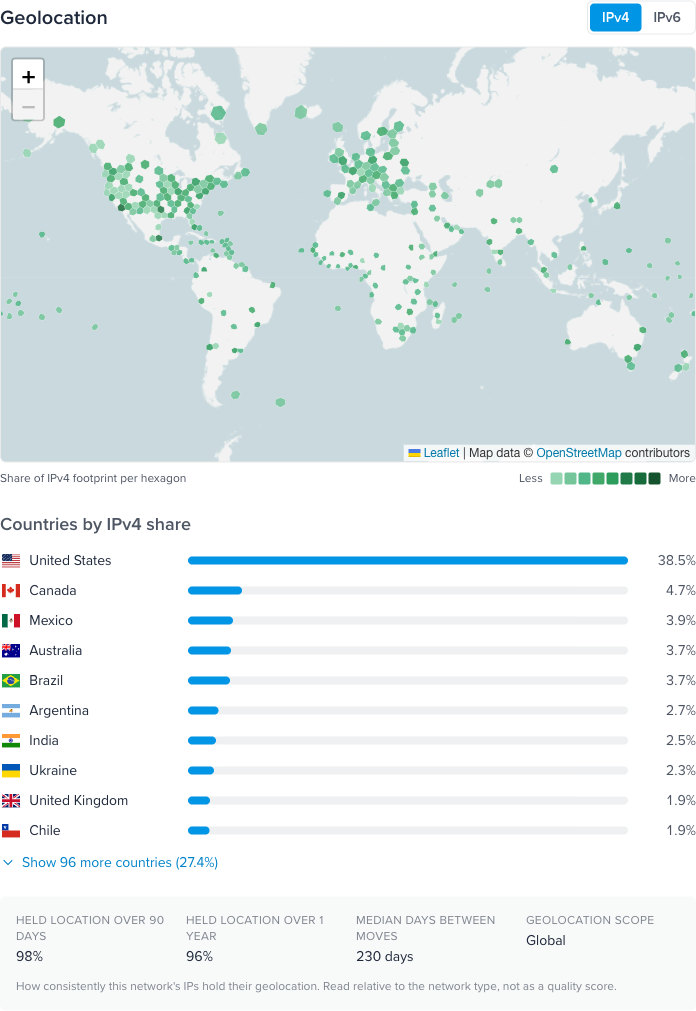
- Footprint: 106 countries: United States 38.5%, Canada 4.7%, Mexico 3.9%, Australia 3.7%, Brazil 3.7%, and a very long tail
- Scope: Global
- Held location over 90 days: 98%
- Median days between moves: 230 days
Here's the one that surprises people. The intuition says satellite internet should be a geolocation nightmare. The infrastructure is literally moving at 27,000 km/h. The data says otherwise: 98% of Starlink's IPs held their location over 90 days, with a median of 230 days between moves. That's more stable than Telecom Italia's fixed-line network.
The reason is that Starlink's addressing is anchored to the ground, not the sky. IPs are allocated through regional gateways and points of presence, and Starlink commits to assigning each customer an IP in the same country as their service address; the company even publishes its own prefix-to-city geofeed. Terminals do occasionally get rehomed to a different ground station, and that's exactly what the 230-day median is counting. The map shows the true shape of the business: one network, six continents, and a footprint that tracks where people lack fiber, not where they have it.
M247 (AS9009)
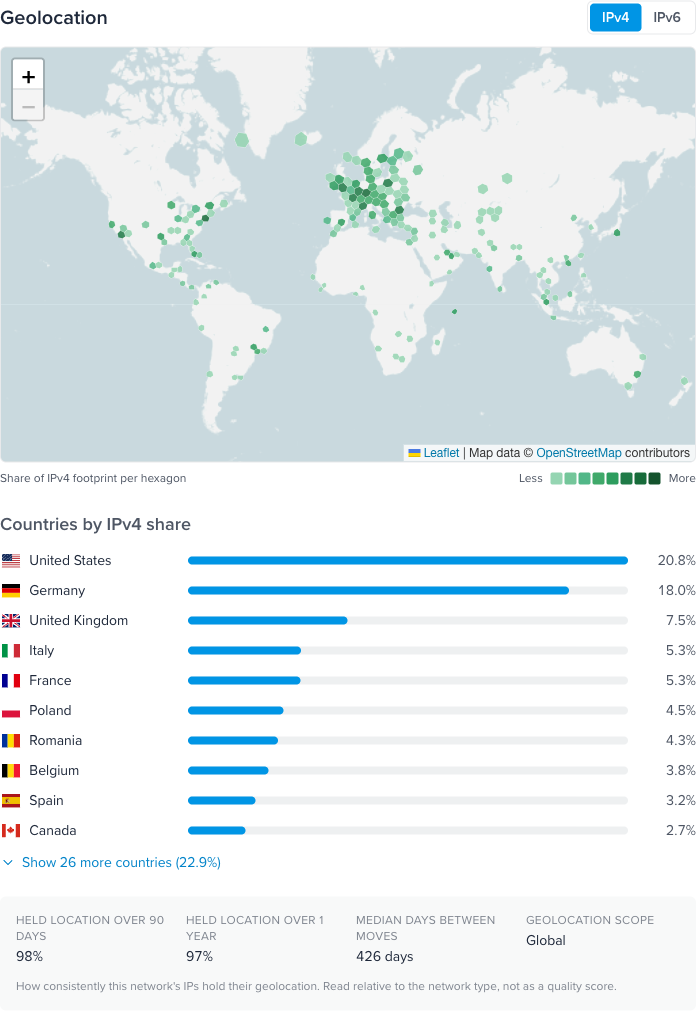
- Footprint: 36 countries: United States 20.8%, Germany 18.0%, United Kingdom 7.5%, Italy 5.3%, France 5.3%, and onward
- Scope: Global
- Held location over 90 days: 98%
- Median days between moves: 426 days
M247 is a hosting provider whose infrastructure powers a large share of the commercial VPN market, and its map is a fingerprint you learn to recognize instantly. There's no home country: no single place holds even a quarter of the footprint. Instead: dozens of tidy, city-sized presences, one per VPN exit location, spread across 36 countries.
Compare the shapes. Telecom Italia's map looks like a population. M247's looks like a route network: points, not regions. When a network registered in one country operates dense little outposts in 36 of them, that's not an ISP serving customers; that's infrastructure serving someone else's customers. If you work in fraud or risk, this map is the "why" behind a lot of privacy detection flags.
AT&T's mobile network (AS20057)
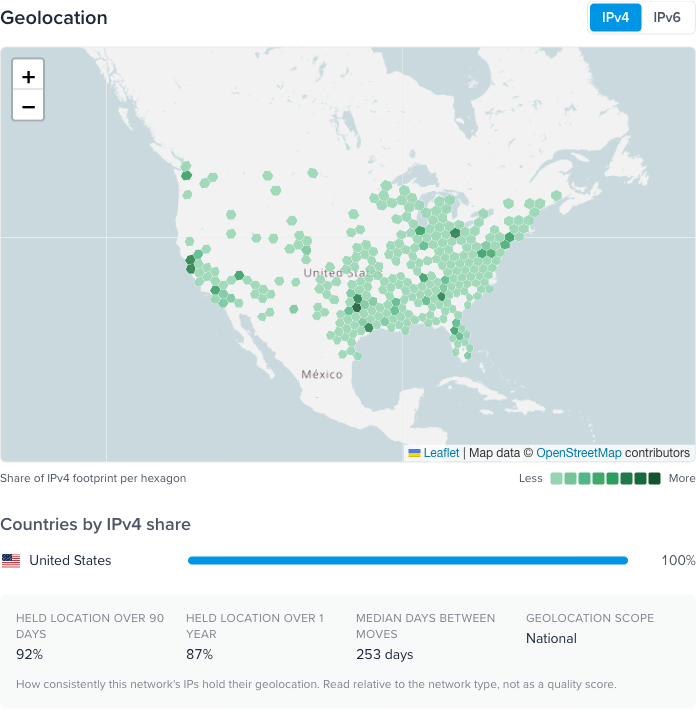
- Footprint: United States, 100%
- Scope: National
- Held location over 90 days: 92%
- Median days between moves: 253 days
AS20057, AT&T's wireless network (registered today as AT&T Enterprises, LLC after years as AT&T Mobility LLC), is the example that shows why the geolocation scope field exists. The footprint is 100% United States and remarkably stable at that level: 92% held over 90 days. But the scope says National, and that one word is doing important work: it's telling you the country is the level at which this geolocation deserves your trust.
Mobile carriers route traffic through gateways that can sit hundreds of miles from the phone. A subscriber in Denver can surface on an IP that last month served Dallas. Rather than pretend otherwise, the scope field says so up front: for this network, trust the country, be skeptical of the city. It's the difference between data that's confident and data that's honest, and in geolocation, honest is worth more.
Cloudflare (AS13335)
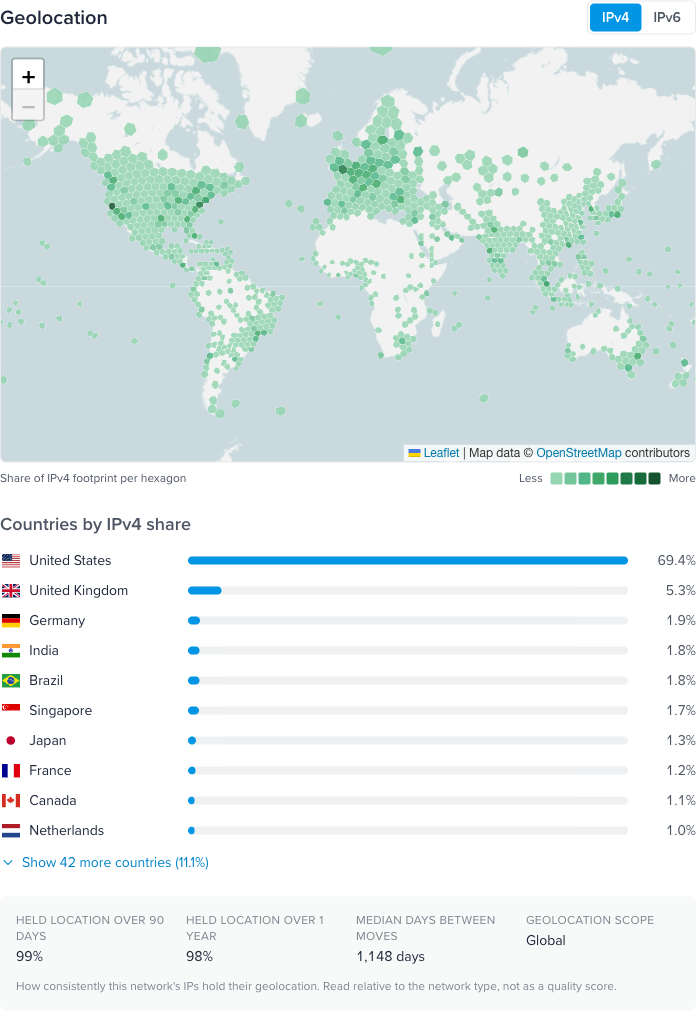
- Footprint: 52 countries: United States 69.4%, United Kingdom 5.3%, Germany 1.9%, and a global tail
- Scope: Global
- Held location over 90 days: 99%
- Median days between moves: 1,148 days
At the far end of the stability spectrum sits Cloudflare. Its IPs held location 99% over 90 days, and the median time between moves is 1,148 days. The median Cloudflare IP hasn't moved in over three years.
That's what anycast infrastructure looks like: addresses are announced from fixed points of presence and simply stay there, year after year. The map clusters on datacenter hubs, the places where the internet's plumbing concentrates, rather than where people live. Put Cloudflare's map next to Telecom Italia's and you're looking at the two poles of the internet: one network shaped like humanity, one shaped like machinery.
What You Can Do With This
Each of these maps answers a question someone asks us every week:
- Fraud and risk teams: when a signup arrives from a "European hosting provider," the map tells you whether that network is a regional ISP or a 36-country VPN constellation like M247. The shape of the footprint is a risk signal in itself.
- Geofencing and compliance: before you rely on country-level rules for a network, confirm it actually stays within one country. Telecom Italia's 100%-Italy footprint validates the assumption; a long country tail warns you it won't hold.
- Ad targeting and localization: the scope field tells you when city-level precision is real and when, as with mobile carriers, you should stop at the country and save your budget.
- Network research and peering: see a network's true operating footprint instead of its registration paperwork, and how that footprint splits between IPv4 and IPv6.
How to Read a Map in Three Seconds
Once you've seen a few, the patterns jump out:
And the stability numbers follow the same rule: read them against the network type. Frequent moves inside one country is a healthy consumer ISP. IPs that never move is healthy infrastructure. The anomalies, like the datacenter that churns or the "ISP" scattered across 30 countries, are where the interesting questions start.
Where to Find It
Geolocation distribution is live now on every ASN page, free to explore, with IPv4 and IPv6 views. Start with the networks above (AS3269, AS14593, AS9009, AS20057, AS13335) or look up the networks you deal with every day. Every one of them has a shape.
Want this data in your own systems? Talk to our team about API access and data downloads.
Share this article


About the authors

Ben Dowling is Co-CEO and founder of IPinfo. Since founding the company in 2013, he has helped shape the IP intelligence industry by making accurate, verified internet data more accessible to organizations worldwide.

As the product marketing manager, Fernanda helps customers better understand how IPinfo products can serve their needs.